


The effects of one of the Trump Administration's most aggressive policy objectives, a crackdown on illegal immigration, have differed by region.
A Kristen Bialik post for the Pew Research Center maps out the effects of the Trump Administration's immigration policies and enforcement:
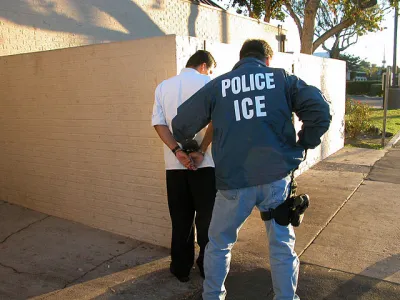
After years of decline, the number of arrests made by U.S. Immigration and Customs Enforcement (ICE) climbed to a three-year high in fiscal 2017, according to data from the agency. The biggest percentage increases were in Florida, northern Texas and Oklahoma.
The article explains more of the trends in immigration arrests since Trump has taken office (e.g., though the number of arrests increased from 2016, the number of arrests was still higher in 2009) as well as the focus of ICE's activities around the country. The post also presents all of this new data in several maps, which illustrate the scope of the Trump Administration's enforcement of immigration law.
Here's how the post sums up the geographic trends apparent in the data:
The overall number of immigration arrests made by ICE in 2017 varied around the U.S., and the most arrests did not always occur in areas close to the U.S.-Mexico border or in places with the largest unauthorized immigrant populations (such as the New York and Los Angeles metro areas).
ICE arrests were highest in the agency’s Dallas area (16,520), which also saw the largest increase in absolute numbers between 2016 and 2017 (up 6,886). The Houston and Atlanta areas had the second- and third-highest totals in 2017 (each around 13,500), followed by the Chicago, San Antonio and Los Angeles areas (each with roughly 8,500 arrests).
Hat tip to Tanvi Misra for sharing the news of the arrest data and lending additional perspective to the new immigration arrest data.
FULL STORY: ICE arrests went up in 2017, with biggest increases in Florida, northern Texas, Oklahoma

DOT Memo Directs Transportation Funding to Communities With Higher Marriage and Birth Rates, Compliance with Immigration Officials and No Mask Mandates
The memo ties immigration enforcement to federal funding and prohibits mask or vaccine mandates.
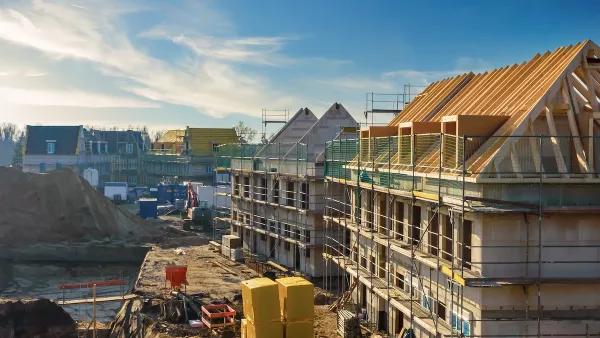
How Might Tariffs and Deportations Affect Affordable Housing Development?
Many affordable housing developers worry Trump’s proposed taxes on imports and crackdown on immigration will be detrimental to the industry. Others hope deregulation reduces development costs enough to offset those effects. What’s the most likely outcome?

Chicago Latino Corridor Hollowed Out Amid Deportation Fears
Foot traffic and business in the largely Latino Little Village neighborhood declined by as much as 50 percent, with many businesses staying closed on Tuesday.

Analysis: Cybertruck Fatality Rate Far Exceeds That of Ford Pinto
The Tesla Cybertruck was recalled seven times last year.

National Parks Layoffs Will Cause Communities to Lose Billions
Thousands of essential park workers were laid off this week, just before the busy spring break season.

Retro-silient?: America’s First “Eco-burb,” The Woodlands Turns 50
A master-planned community north of Houston offers lessons on green infrastructure and resilient design, but falls short of its founder’s lofty affordability and walkability goals.

Test News Post 1
This is a summary

Analysis: Cybertruck Fatality Rate Far Exceeds That of Ford Pinto
The Tesla Cybertruck was recalled seven times last year.

Test News Headline 46
Test for the image on the front page.
Urban Design for Planners 1: Software Tools
This six-course series explores essential urban design concepts using open source software and equips planners with the tools they need to participate fully in the urban design process.
Planning for Universal Design
Learn the tools for implementing Universal Design in planning regulations.
EMC Planning Group, Inc.
Planetizen
Planetizen
Mpact (formerly Rail~Volution)
Great Falls Development Authority, Inc.
HUDs Office of Policy Development and Research
NYU Wagner Graduate School of Public Service