


The roads in your city might conform to a grid, or they might divert around natural resources or landmarks. A new tool aims to help you visualize the "hidden logic" behind urban growth.
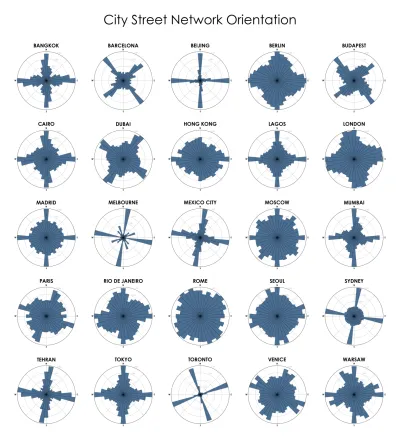
"It works by using an old geography technique: the 'polar' or circular chart. Boeing's tool calculates what percentage of a city's roads run along each section of a compass, and plots it on a circular bar chart."
Because the majority of streets in Manhattan, for example, align along a grid, its network is primarily encompassed in four long bars radiating out from the center of the circle. A few shorter bars represent the smaller portion of streets that don't line up.
Montgomery notes that a similar concept was created recently by data scientist Seth Kadish, but Boeing's adaptation made the model usable by anyone with knowledge of the programming language Python. Developer Vladimir Agafonkin built on Boeing's work to build a version for web browsers, so that "anyone can use a typical web mapping interface to visit any city or other region in the world and see a polar chart of its street grid."
"'It's a wonderful way to explore how cities are built; understand their hidden patterns and influences,' said Agafonkin. 'You can see where a road network was meticulously planned and where it grew naturally. [You can] see subtle connections like terrain, water bodies and nearby attractions influencing the direction of roads.'"
FULL STORY: Visualizing the Hidden ‘Logic’ of Cities

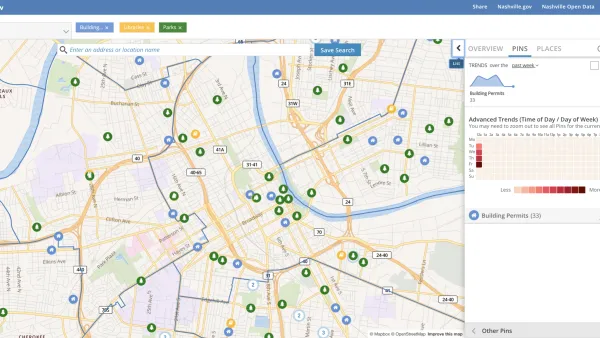
Presenting Municipal Data in an Interactive Map, Nashville Style
The city of Nashville launched the NashView interactive data map earlier this month.

Metrorail Travel Patterns Revealed
Commute data for one of the nation's premier rail transit systems, revealed.

How the National Park Service Uses GIS
A new book demonstrates how the National Park Service uses GIS technology to meet its mission and showcases a selection of maps used for effectively managing national parks.

Analysis: Cybertruck Fatality Rate Far Exceeds That of Ford Pinto
The Tesla Cybertruck was recalled seven times last year.

National Parks Layoffs Will Cause Communities to Lose Billions
Thousands of essential park workers were laid off this week, just before the busy spring break season.

Retro-silient?: America’s First “Eco-burb,” The Woodlands Turns 50
A master-planned community north of Houston offers lessons on green infrastructure and resilient design, but falls short of its founder’s lofty affordability and walkability goals.

Test News Post 1
This is a summary

Analysis: Cybertruck Fatality Rate Far Exceeds That of Ford Pinto
The Tesla Cybertruck was recalled seven times last year.

Test News Headline 46
Test for the image on the front page.
Urban Design for Planners 1: Software Tools
This six-course series explores essential urban design concepts using open source software and equips planners with the tools they need to participate fully in the urban design process.
Planning for Universal Design
Learn the tools for implementing Universal Design in planning regulations.
EMC Planning Group, Inc.
Planetizen
Planetizen
Mpact (formerly Rail~Volution)
Great Falls Development Authority, Inc.
HUDs Office of Policy Development and Research
NYU Wagner Graduate School of Public Service