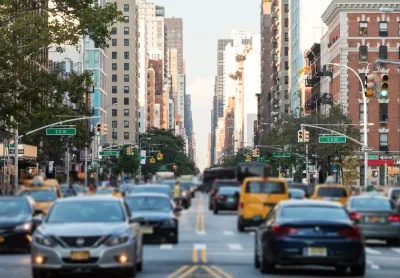
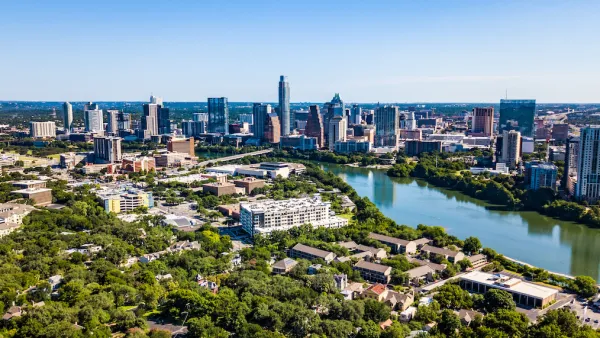
A consumption-based analysis illustrates the differences in average household emissions across census tracts.

A set of maps based on University of California, Berkeley research highlights the climate impact of households in different neighborhoods, as outlined in a New York Times article by Nadja Popovich, Mira Rojanasakul, and Brad Plumer.
The data indicates that, while households in central cities tend to have lower carbon footprints thanks to access to transit and smaller homes, wealthier neighborhoods, even in dense, transit-rich cities like New York, have larger footprints than their close neighbors. “The researchers used a model, a simplified mathematical representation of the real world, to estimate the average household’s emissions in each neighborhood based on electricity use, car ownership, income levels, consumption patterns and more.”
The consumption-based analysis traces emissions to the households responsible for them rather than measuring them at the point of production. “The original idea behind the research, which began more than a decade ago, was to connect climate change with daily life, to help people understand how their choices contribute to a global problem,” according to Chris Jones, director of the CoolClimate Network at Berkeley, who developed the methodology.
The article points out that consumption results from a series of decisions, some made at the individual level, others, such as housing and transportation policy, at systemic levels. Now, Jones hopes cities can use the data to identify the most climate-friendly policies “by, for example, encouraging developers to build more housing in neighborhoods where people don’t need cars to get around or helping households in suburbs more quickly adopt cleaner electric vehicles.”
FULL STORY: The Climate Impact of Your Neighborhood, Mapped

Analysis: Cybertruck Fatality Rate Far Exceeds That of Ford Pinto
The Tesla Cybertruck was recalled seven times last year.

National Parks Layoffs Will Cause Communities to Lose Billions
Thousands of essential park workers were laid off this week, just before the busy spring break season.

Retro-silient?: America’s First “Eco-burb,” The Woodlands Turns 50
A master-planned community north of Houston offers lessons on green infrastructure and resilient design, but falls short of its founder’s lofty affordability and walkability goals.

Test News Post 1
This is a summary

Analysis: Cybertruck Fatality Rate Far Exceeds That of Ford Pinto
The Tesla Cybertruck was recalled seven times last year.

Test News Headline 46
Test for the image on the front page.
Urban Design for Planners 1: Software Tools
This six-course series explores essential urban design concepts using open source software and equips planners with the tools they need to participate fully in the urban design process.
Planning for Universal Design
Learn the tools for implementing Universal Design in planning regulations.
EMC Planning Group, Inc.
Planetizen
Planetizen
Mpact (formerly Rail~Volution)
Great Falls Development Authority, Inc.
HUDs Office of Policy Development and Research
NYU Wagner Graduate School of Public Service


