


The New York Times illustrates the scope and scale of the great project still facing the United States: to decrease greenhouse gas emissions from the transportation sector of its economy.
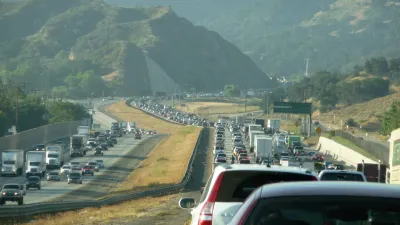
"Transportation is the largest source of planet-warming greenhouse gases in the United States today and the bulk of those emissions come from driving in our cities and suburbs."
So reads the introduction to an interactive map published by The New York Times, claiming to be the most detailed map of auto emissions in the United States, using data from Boston University's Database of Road Transportation Emissions.
"Even as the United States has reduced carbon dioxide emissions from its electric grid, largely by switching from coal power to less-polluting natural gas, emissions from transportation have remained stubbornly high," write Nadja Popovich and Denise Lu in the article that runs alongside the interactive map.
"The bulk of those emissions, nearly 60 percent, come from the country’s 250 million passenger cars, S.U.V.s and pickup trucks, according to the Environmental Protection Agency. Freight trucks contribute an additional 23 percent."
The article discusses the state of environmental regulation as the transition between the Obama and Trump administrations begins to have consequential outcomes for the nation's environmental policies. The article also teases out some of the geographic distinctions illustrated by the map:
Boston University’s emissions database, first published in 2015 and updated this week with an additional five years of data, reveals that much of the increase in driving-related CO2 has occurred in and around cities.
New York City and Los Angeles lead the country in terms of the total number of emissions—in line with those cities' positions as the two most populous in the country. Emissions in both cities, however, have grown significantly since 1990.
The map isn't the only interactive graphic included in the article, and Los Angeles and New York City are far from the only cities with growing emissions, measured both by total and per capita.
FULL STORY: The Most Detailed Map of

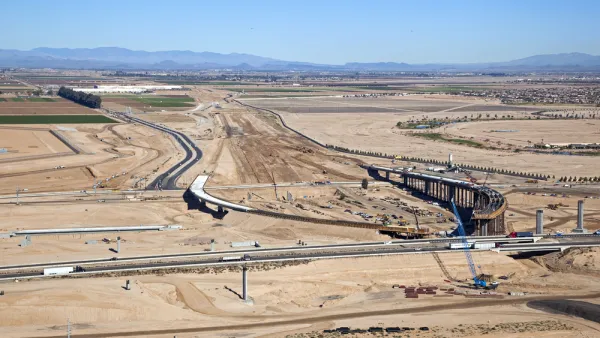
Infrastructure Funding Could Lead to Higher Carbon Emissions
Billions in federal infrastructure funding slated to go to states with few strings attached could fund roadway construction and widening projects that will raise greenhouse gas emissions and worsen climate change.

Assessing Prince George's County's Climate Action Plan
The Prince George's County draft Climate Action Plan includes ambitious goals and timetables, but falls short of recommended targets for emissions reductions in the transportation sector.
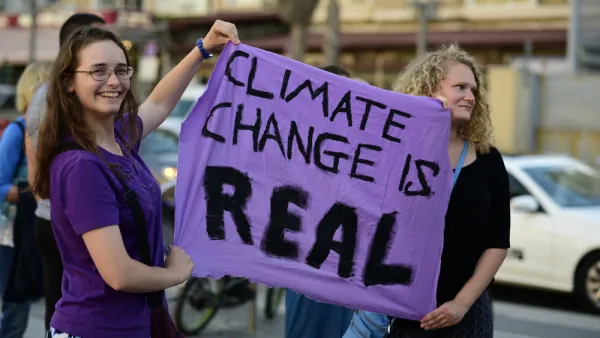
Report: How The U.S. Could Meet Its 2030 Climate Goals
If policymakers don't take clear, immediate action, emissions reductions will fall short of the 50-52 percent goal set in Paris.

Analysis: Cybertruck Fatality Rate Far Exceeds That of Ford Pinto
The Tesla Cybertruck was recalled seven times last year.

National Parks Layoffs Will Cause Communities to Lose Billions
Thousands of essential park workers were laid off this week, just before the busy spring break season.

Retro-silient?: America’s First “Eco-burb,” The Woodlands Turns 50
A master-planned community north of Houston offers lessons on green infrastructure and resilient design, but falls short of its founder’s lofty affordability and walkability goals.

Test News Post 1
This is a summary

Analysis: Cybertruck Fatality Rate Far Exceeds That of Ford Pinto
The Tesla Cybertruck was recalled seven times last year.

Test News Headline 46
Test for the image on the front page.
Urban Design for Planners 1: Software Tools
This six-course series explores essential urban design concepts using open source software and equips planners with the tools they need to participate fully in the urban design process.
Planning for Universal Design
Learn the tools for implementing Universal Design in planning regulations.
EMC Planning Group, Inc.
Planetizen
Planetizen
Mpact (formerly Rail~Volution)
Great Falls Development Authority, Inc.
HUDs Office of Policy Development and Research
NYU Wagner Graduate School of Public Service