Why didn’t the chicken cross the road? Because pedestrian Level-Of-Service was below “C”.
Why didn't the chicken cross the road?
Because pedestrian Level-Of-Service was below "C".
Let me explain. Last week I attended the ProBike/ProWalk conference in Chattanooga, Tennessee. It was a wonderful event populated by a tribe of nonmotorized transportation planners and activists who do good work and have lots of fun too - my sort of folks. One highlight was a presentation on new, multi-modal Level-Of-Service (LOS) indicators which are starting to revolutionize transport planning.
Level of Service refers to Performance Indicators that rate transport system service quality from A (best) to F (worst), similar to elementary school grades. Planners use LOS rating to identify problems and prioritize improvements. Facilities with LOS below C are generally considered to fail and therefore require improvement.
This approach seems rational and fair, but is really anything but. The problem is that, until now, this system only considered automobile travel conditions.
For example, conventional analysis generally defines roadway expansion as a transport system improvement, although wider roads and faster vehicle traffic degrade walking and cycling conditions (called the Barrier Effect or Severance), and therefore public transit travel since most transit trips have walking links. Conventional analysis ignores these negative impacts, which skews planning decisions to favor automobile mobility to the detriment to other forms of access. The result is automobile dependency and sprawl.
But that is starting to change. During the last decade a team of leading transport engineers and planners sponsored by the National Cooperative Highway Research Program developed multi-modal Level-Of-Service rating systems. Their research results are published in the report, Multimodal Level Of Service Analysis For Urban Streets, and subsequent Publications that provide detailed guidance for measuring the quality of walking, cycling and public transport travel under specific conditions, and therefore the impacts of particular system changes, either positive or negative, on the ease of travel by these modes.
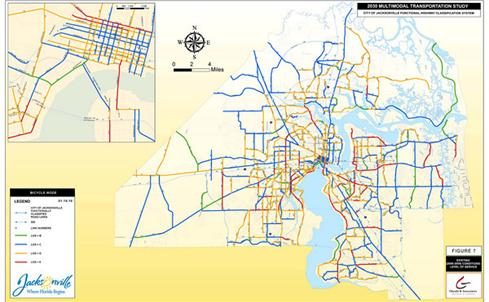
The results are already being used by progressive planning agencies. For example, Jacksonville, Florida developed a Multi-Modal Transportation Plan which uses pedestrian and cycling Level-Of-Service ratings to prioritize walking and cycling improvements, as shown in the following maps.
Pedestrian LOS Map - Jacksonville, FL

This map illustrates pedestrian level-of-service, which shows the quality of walking conditions.
Proposed Pedestrian Improvement Map - Jacksonville, FL

This map illustrates where walking facility improvements will be implemented.
Cycling LOS Map - Jacksonville, FL

This map illustrates bicycling level-of-service, which shows the quality of cycling conditions.
Cycling Improvement Map - Jacksonville, FL

This map illustrates where cycling facility improvements will be implemented.
Automobile LOS is relatively easy to calculate, based on volume-to-capacity ratios (abbreviated V/C) to quantify traffic congestion. Other LOS ratings require more data, such as the presence and quality of sidewalks or paths; the speed, volume, separation distance, and portion of heavy vehicles in adjacent motor vehicle traffic; and the average delay that pedestrians and cyclists experience when they try to cross the roadway. However, much of this information is already collected or can be during regular field surveys, so with good planning communities can implement multi-modal transport system performance evaluation.
These multi-modal LOS methods are being incorporated into the upcoming revision of the Highway Capacity Manual (HCM), which is the main reference document used by transport planners and engineers to evaluate roadway capacity and service quality. The 2010 Edition, and its support software, will provide guidance and specific computation methodologies for evaluating walking, cycling and public transport, as well as automobile travel conditions. This will be a great leap forward in creating a more level playing field between modes, and therefore a more efficient and equitable transport system.
Special note: The current Wikipedia Level-Of-Service entry contains little information on multi-modal LOS. Please contact me ([email protected]) if you would like to help update it, particularly if you have experience editing Wikipedia.
For More Information
Richard Dowling, et al. (2008), Multimodal Level Of Service Analysis For Urban Streets, NCHRP Report 616, Transportation Research Board (www.trb.org); at http://trb.org/news/blurb_detail.asp?id=9470; User Guide at http://onlinepubs.trb.org/onlinepubs/nchrp/nchrp_w128.pdf.
FDOT (2002), Quality/Level of Service Handbook, Florida Department of Transportation (www.dot.state.fl.us); at www.dot.state.fl.us/planning/systems/sm/los/los_sw2.shtm. Kittelson (2003), Transit Capacity and Quality of Service Manual, Second Edition, Report 100, Transit Cooperative Research Program, TRB (www.trb.org); at www.trb.org/news/blurb_detail.asp?id=2326.
Christopher Leinberger (2007), Footloose and Fancy Free: A Field Survey of Walkable Urban Places in the Top 30 U.S. Metropolitan Areas, Brookings Institution (www.brookings.edu); at www.brookings.edu/~/media/Files/rc/papers/2007/1128_walkableurbanism_leinberg/1128_walkableurbanism_leinberger.pdf.
Todd Litman (2008), Introduction to Multi-Modal Transport Planning, VTPI (www.vtpi.org); at www.vtpi.org/multimodal_planning.pdf.
Nathan McNeil (2010), Bikeability and the Twenty-Minute Neighborhood: How Infrastructure and Destinations Influence Bicycle Accessibility, Portland State University (www.ibpi.usp.pdx.edu); at www.ibpi.usp.pdx.edu/media/McNeil_Bikeability_June2010.pdf.
Ronald Milam and Chris Mitchell (2008), Conventional Level of Service Analysis, Thresholds, and Policies Get a Failing Grade, TRB Annual Meeting (www.trb.org); at http://opr.ca.gov/sch/pdfs/LOS_Climate_Change_Smart_Growth.pdf. NYC (2006), New York City Pedestrian Level of Service Study, New York City (www.nyc.gov); at www.nyc.gov/html/dcp/html/transportation/td_ped_level_serv.shtml.
PPS (2008), A Citizen's Guide to Better Streets, Project for Public Spaces (www.pps.org); at www.pps.org/pdf/bookstore/How_to_Engage_Your_Transportation_Agency_AARP.pdf.
Quality/Level of Service Website (www.dot.state.fl.us/planning/systems/sm/los/default.shtm) by the Florida Department of Transportation provides extensive information on multi-modal level-of-service evaluation tools and professional development programs. TRB (2010), Highway Capacity Manual, Transportation Research Board (www.trb.org); at http://rip.trb.org/browse/dproject.asp?n=16893.
Walkability Tools Research Webpage (www.levelofservice.com) provides guidance and data for Community Street Review (CSR) analysis of walkability.
Wilbur Smith (2008), Traffic & Transportation Policies and Strategies in Urban Areas in India, Ministry of Urban Development (www.urbanindia.nic.in); at http://urbanindia.nic.in/moud/programme/ut/Traffic_transportation.pdf.

National Parks Layoffs Will Cause Communities to Lose Billions
Thousands of essential park workers were laid off this week, just before the busy spring break season.

Retro-silient?: America’s First “Eco-burb,” The Woodlands Turns 50
A master-planned community north of Houston offers lessons on green infrastructure and resilient design, but falls short of its founder’s lofty affordability and walkability goals.

Delivering for America Plan Will Downgrade Mail Service in at Least 49.5 Percent of Zip Codes
Republican and Democrat lawmakers criticize the plan for its disproportionate negative impact on rural communities.

Test News Post 1
This is a summary

Test News Headline 46
Test for the image on the front page.

Balancing Bombs and Butterflies: How the National Guard Protects a Rare Species
The National Guard at Fort Indiantown Gap uses GIS technology and land management strategies to balance military training with conservation efforts, ensuring the survival of the rare eastern regal fritillary butterfly.
Urban Design for Planners 1: Software Tools
This six-course series explores essential urban design concepts using open source software and equips planners with the tools they need to participate fully in the urban design process.
Planning for Universal Design
Learn the tools for implementing Universal Design in planning regulations.
EMC Planning Group, Inc.
Planetizen
Planetizen
Mpact (formerly Rail~Volution)
Great Falls Development Authority, Inc.
HUDs Office of Policy Development and Research
NYU Wagner Graduate School of Public Service


