


MIT’s Senseable City Lab produced a beautiful visualization of every taxi ride taken in New York City in 2011. More valuable than the pretty pictures, however, are the insights the data provide about creating a more efficient transportation system.
Emily Badger shares news of a spectacularly enlightening mapping project called HubCab, by MIT’s Senseable City Lab. “The Senseable City Lab submitted a public records request to the New York City Taxi and Limousine Commission for all its data on those 150 million trips from 2011. They've mapped it in gorgeous, interactive detail,” writes Badger.
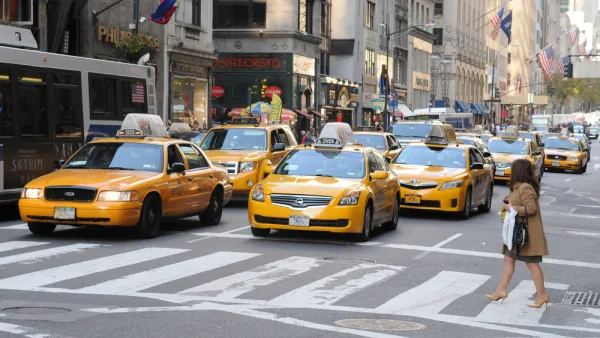
“In 2011, there were more than 150 million taxi trips taken in New York City that began or ended in Manhattan, traveling inside 13,586 registered cabs,” according to HubCab’s data, but the patters of those trips reveal redundancies that, at least in theory, help make the city’s taxi system work more efficiently.
For instance, “Taxis ferried passengers from Grand Central Station to near Union Square some 73,000 times, and from Union Square to Grand Central Station 94,000 more.” The obvious question, then, is “what would happen…if we could optimize the entire taxi network in New York as if it were a single, integrated, all-seeing system?” According to HubCab’s analysis, “a totally optimized taxi network in New York would produce 40 percent fewer trips, a similar drop in emissions, and far less traffic.”
What's preventing from implementing improvements to the system now? Although HubCab has done the analysis, someone would have to develop the technology to pair riders. Then there is the loss of business for taxi drivers (who are already under pressure from new forms of technologically-enabled competition) and the fact that many people don’t want to share cabs. "There are psychological barriers," says Michael Szell, one of Senseable City Lab’s researchers. "There are many people who don’t want to sit next to a stranger in a cab. In practice, this percentage would be much lower than 100 percent, maybe more like 10 percent in the beginning."
FULL STORY: How a System for Shared Taxi Rides Could Transform New York City

Ride-Hailing Prices Skyrocket as the U.S. Emerges From the Pandemic
A shortage of drivers and spiking demand are driving Uber and Lyft prices higher than ever as the companies struggle to achieve profitability.
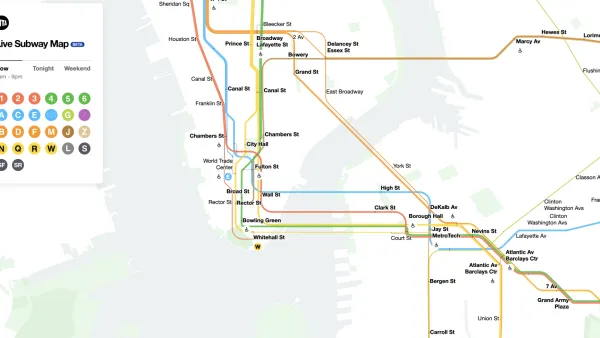
The New New York Subway Map Works in Real Time
There's a new chapter, and maybe an end, for the "Great Subway Map Debate."
Friday Eye Candy: A Sorely-Needed Map of New York City Neighborhoods
Neighborhoods don't get the same official boundaries as cities, counties, states, and countries. So how do we know where one neighborhood ends and another begins?

Analysis: Cybertruck Fatality Rate Far Exceeds That of Ford Pinto
The Tesla Cybertruck was recalled seven times last year.

National Parks Layoffs Will Cause Communities to Lose Billions
Thousands of essential park workers were laid off this week, just before the busy spring break season.

Retro-silient?: America’s First “Eco-burb,” The Woodlands Turns 50
A master-planned community north of Houston offers lessons on green infrastructure and resilient design, but falls short of its founder’s lofty affordability and walkability goals.

Test News Post 1
This is a summary

Analysis: Cybertruck Fatality Rate Far Exceeds That of Ford Pinto
The Tesla Cybertruck was recalled seven times last year.

Test News Headline 46
Test for the image on the front page.
Urban Design for Planners 1: Software Tools
This six-course series explores essential urban design concepts using open source software and equips planners with the tools they need to participate fully in the urban design process.
Planning for Universal Design
Learn the tools for implementing Universal Design in planning regulations.
EMC Planning Group, Inc.
Planetizen
Planetizen
Mpact (formerly Rail~Volution)
Great Falls Development Authority, Inc.
HUDs Office of Policy Development and Research
NYU Wagner Graduate School of Public Service