


Data journalism site FiveThirtyEight wades into the complex world of transit ridership data, looking for insights into which cities make use of robust transit systems, and which still have work to do.
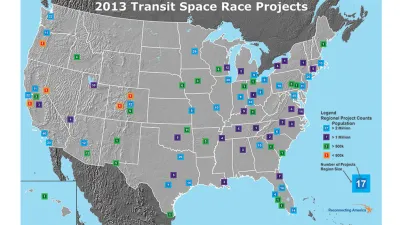
Reuben Fischer-Baum analyzes monthly ridership data from the National Transit Database and population estimates from the American Community Survey to calculate 'trips per resident" for 290 urbanized areas. The metric allows a comparison of transit trips between cities of varying sizes.
One of the larger questions examined by the article in reaction to the data follows: "Do certain regions tend to support better public transit, or is this just a product of city size and density?" Here's how Fischer-Baum responds:
"Among all 290 cities, there’s a clear relationship between trips per resident and both total population (the r-squared is 0.41) and population density (r-squared = 0.21). This means that it’s not particularly revealing to map all the cities together, because larger, denser cities are clustered in the Northeast and on the West Coast. But if we look only at the 248 urban areas with fewer than 1 million residents, the total population relationship (r-squared = 0.0002) and population density relationship (r-squared = 0.07) disappear."
FULL STORY: How Your City’s Public Transit Stacks up


Bike Share Lessons From the Pandemic
Bike share data from six U.S. cities offer insight into how Americans have changed travel patterns during the pandemic.
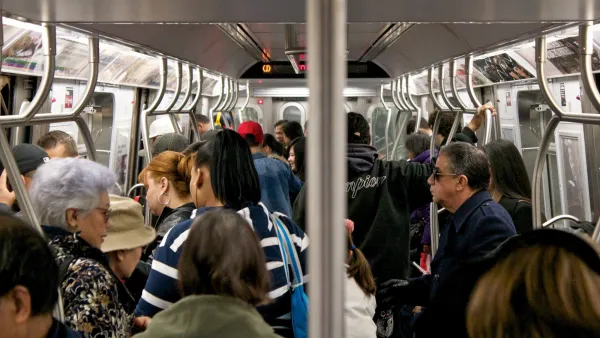
Transit Ridership Dropping Due to Coronavirus; Long-Term Funding Consequences Feared
The effects of a global pandemic on American shores are beginning to emerge for public transit systems. The consequences of a drop in transit ridership could extend beyond the end of the pandemic.
U.S. Transit Ridership Growing Again
The growth in transit rips in the United States over the course of the second and third quarters of 2019 can be traced to growth in two key cities.

Analysis: Cybertruck Fatality Rate Far Exceeds That of Ford Pinto
The Tesla Cybertruck was recalled seven times last year.

National Parks Layoffs Will Cause Communities to Lose Billions
Thousands of essential park workers were laid off this week, just before the busy spring break season.

Retro-silient?: America’s First “Eco-burb,” The Woodlands Turns 50
A master-planned community north of Houston offers lessons on green infrastructure and resilient design, but falls short of its founder’s lofty affordability and walkability goals.

Test News Post 1
This is a summary

Analysis: Cybertruck Fatality Rate Far Exceeds That of Ford Pinto
The Tesla Cybertruck was recalled seven times last year.

Test News Headline 46
Test for the image on the front page.
Urban Design for Planners 1: Software Tools
This six-course series explores essential urban design concepts using open source software and equips planners with the tools they need to participate fully in the urban design process.
Planning for Universal Design
Learn the tools for implementing Universal Design in planning regulations.
EMC Planning Group, Inc.
Planetizen
Planetizen
Mpact (formerly Rail~Volution)
Great Falls Development Authority, Inc.
HUDs Office of Policy Development and Research
NYU Wagner Graduate School of Public Service