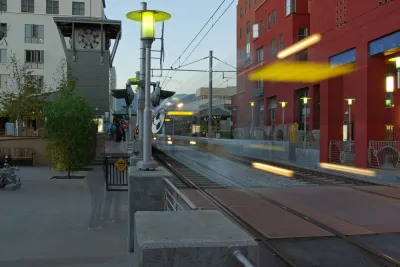
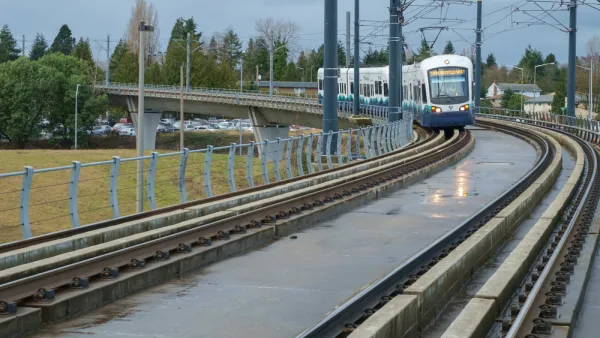
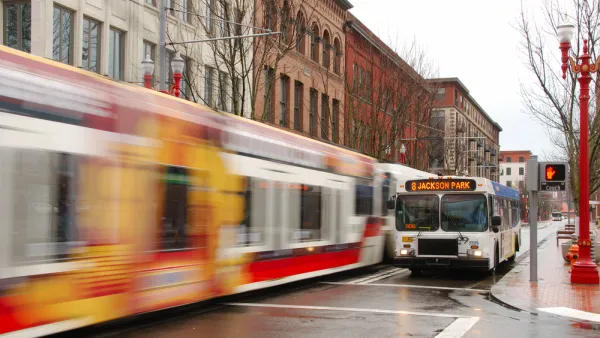
The new TOD Index provides solid information on Transit-Oriented Development impact and benefits. It indicates that home values near rail stations outperform the national market, yet they are also more affordable for residents.

A new report from the TOD Index reveals three important findings for the national real estate industry and housing market:
1. The financial performance of for-sale and rental housing in thousands of neighborhoods near rail stations across the United States significantly out-performs the national housing market. Among all station typologies, Transit Oriented Developments (TODs) are the leading performer.
2. Despite the impressive financial performance of TODs, households that live in TODs spend the lowest percentage of their income on housing and transportation costs, providing $10,000 in additional annual disposable income, on average, compared to the average American household.
3. Households in TODs demonstrate the lowest vehicle ownership rates and highest rates of transit, walk, bike commuting, which has important implications for environmental sustainability.
Dr. John L. Renne, the creator of the TOD Index, stated, "TODs are performing so well in the market because they provide households with options. These options include travel choices, choices of where to eat and shop, and the option to live a lifestyle with lower impacts to the natural environment."
The report finds that TODs residents spend only 24% of their income on housing, compared with the 33% national average, and only spend 13% of their income on transportation compared with the 18% national average. Other key findings from the TOD Index include:
- The average home value in a TOD was $518 per sq. ft. compared to the Zillow Home Value Index of $149 per sq. ft. for the average home in the United States.
- Rental rates in TODs was $2.28 per sq. ft. compared to the Zillow Rent Index value of $0.89 per sq. ft. for the average rental in the U.S.
- Since the start of the economic recovery, in January 2012, TOD home values grew by 37% as compared to a 20% growth for the average American home.
- Since January 2012, rental rates grew by 18% in TODs compared to 8% growth nationally.
Renne notes, "Even though TOD homes cost more on a per square foot basis, they are smaller so the overall cost is attainable. Moreover, 72% of households in TODs are renters as compared to 33% for the nation. The barriers to rent housing is much lower than to purchase housing, so that's another dimension of housing affordability present in TODs." However, Renne cautions, "We are not building enough new housing near transit to keep up with the pace of growing demand, especially among the Millennials, so it will likely become less and less affordable in the near future."
The TOD Index methodology found that two-thirds of all rail stations across the United States are not TODs because they are not dense enough and/or not considered walkable.
Renne stated, "It should be a no brainer to promote policy to increase housing supply and promote walkability around underutilized rail stations because the government investment in the transit system has already been made. The market is speaking and Americans increasingly want to live in TODs."
* * *
The TOD Index was created by Dr. John L. Renne. Dr. Renne is the founder and Managing Director of The TOD Group, is a faculty member, Director and Associate Provost at the University of New Orleans, and is a Senior Visiting Research Associate at the University of Oxford.
FULL STORY: TOD Index

Analysis: Cybertruck Fatality Rate Far Exceeds That of Ford Pinto
The Tesla Cybertruck was recalled seven times last year.

National Parks Layoffs Will Cause Communities to Lose Billions
Thousands of essential park workers were laid off this week, just before the busy spring break season.

Retro-silient?: America’s First “Eco-burb,” The Woodlands Turns 50
A master-planned community north of Houston offers lessons on green infrastructure and resilient design, but falls short of its founder’s lofty affordability and walkability goals.

Test News Post 1
This is a summary

Analysis: Cybertruck Fatality Rate Far Exceeds That of Ford Pinto
The Tesla Cybertruck was recalled seven times last year.

Test News Headline 46
Test for the image on the front page.
Urban Design for Planners 1: Software Tools
This six-course series explores essential urban design concepts using open source software and equips planners with the tools they need to participate fully in the urban design process.
Planning for Universal Design
Learn the tools for implementing Universal Design in planning regulations.
EMC Planning Group, Inc.
Planetizen
Planetizen
Mpact (formerly Rail~Volution)
Great Falls Development Authority, Inc.
HUDs Office of Policy Development and Research
NYU Wagner Graduate School of Public Service


