


Statistics sage Nate Silver crunches the numbers illustrating the relationship between U.S. cities' overall diversity and their neighborhood diversity. His conclusion: the greater diversity, the greater the segregation.
Cities often consider diversity to be among their great assets. And American cities have diversity in spades. But as anyone who's ever visited Watts, Hyde Park, Bel Air, or the Upper West Side knows, the experience of diversity often does not match up with the statistics on diversity.
Celebrity statistician Nate Silver has taken this notion and analyzed the data not just for cities' overall diversity—which is highest in Jersey City, N.J., Oakland, Calif., and Sacramento, Calif. and lowest in Laredo, Tex., Hialeah, Fla., and Scottsdale, Ariz.—but also for cities' neighborhood diversity. Comparing the two, Silver concludes that some of America's most diverse cities are actually some of the most segregated.
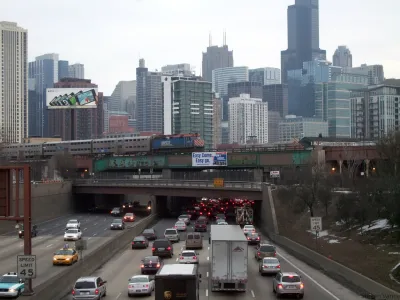
"A few cities actually get pretty close to this ideal of complete diversity. Oakland, California, is not far from being evenly divided between whites, blacks, Hispanics and Asians; its citywide diversity index is 75 percent. New York’s is 73 percent. And Chicago’s is 70 percent. At the low end of the scale are extremely white cities like Lincoln and Scottsdale, Arizona. There’s also extremely black cities like Detroit, and extremely Hispanic cities like Laredo, Texas. Laredo, which is almost entirely Hispanic, has a citywide diversity index of just 8 percent."
"You can have a diverse city, but not diverse neighborhoods. Whereas Chicago’s citywide diversity index is 70 percent, seventh best out of the 100 most populous U.S. cities, its neighborhood diversity index is just 36 percent, which ranks 82nd. New York also has a big gap. Its citywide diversity index is 73 percent, fourth highest in the country, but its neighborhood diversity index is 47 percent, which ranks 49th."
"The integration-segregation index is determined by how far above or below a city is from the regression line. Cities below the line are especially segregated. Chicago, which has a -19 score, is the most segregated city in the country. It’s followed by Atlanta, Milwaukee, Philadelphia, St. Louis, Washington and Baltimore."
FULL STORY: The Most Diverse Cities Are Often The Most Segregated


Black Chicagoans Segregated, Regardless of Income
Latino Chicagoans are more likely to live in diverse neighborhoods than whites or blacks do.

How Cities Can Avoid Perpetuating Segregation
Residents of big cities, known as the ‘melting pots’ of America, have fewer interactions with people outside their socioeconomic group than those in smaller communities, according to new research.

Design Collective Using Black-Centered Approaches to Transform Cities
BlackSpace seeks to empower Black practitioners and change the way planning and design happens in and affects Black communities.

Analysis: Cybertruck Fatality Rate Far Exceeds That of Ford Pinto
The Tesla Cybertruck was recalled seven times last year.

National Parks Layoffs Will Cause Communities to Lose Billions
Thousands of essential park workers were laid off this week, just before the busy spring break season.

Retro-silient?: America’s First “Eco-burb,” The Woodlands Turns 50
A master-planned community north of Houston offers lessons on green infrastructure and resilient design, but falls short of its founder’s lofty affordability and walkability goals.

Test News Post 1
This is a summary

Analysis: Cybertruck Fatality Rate Far Exceeds That of Ford Pinto
The Tesla Cybertruck was recalled seven times last year.

Test News Headline 46
Test for the image on the front page.
Urban Design for Planners 1: Software Tools
This six-course series explores essential urban design concepts using open source software and equips planners with the tools they need to participate fully in the urban design process.
Planning for Universal Design
Learn the tools for implementing Universal Design in planning regulations.
EMC Planning Group, Inc.
Planetizen
Planetizen
Mpact (formerly Rail~Volution)
Great Falls Development Authority, Inc.
HUDs Office of Policy Development and Research
NYU Wagner Graduate School of Public Service