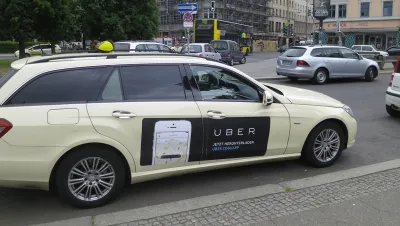
Uber users are getting massive amounts of value from the service, according to a new analysis only possible in the post-transportation network company era.

"Uber has created more than a booming ride-sharing market," according to an article by Adam Creighton. "It’s given economists a treasure trove of data to understand one of the fundamental concepts of economics: the demand curve."
Steven Levitt, author of the best-selling Freakonomics, along with other researchers at the University of Chicago and Oxford worked together with Uber to map out the Uber demand curve, "showing U.S. consumers alone are reaping billions of dollars a year in benefits, far greater than the losses borne by taxi owners."
Such a demand curve was considered "nearly impossible," writes Creighton, until Uber came along. Uber's platform allows the collection of data on a number of the variables that make demand so volatile (i.e., price changes alone don't account for why people buy goods or services):
Uber’s data is unique in two crucial ways. It records not only the time, place, price, and demand-and-supply conditions of every paid ride (encapsulated in a surge factor), but also of every occasion where a customer declines the offered price.
Click through to the article to find out exactly how the new research quantifies Uber's demand curve, along with the implications of the new research on another tricky economic concept: consumer surplus.
[The Wall Street Journal could be blocked by a paywall.]
FULL STORY: Uber’s Pricing Formula Has Allowed Economists to Map Out a Real Demand Curve

Analysis: Cybertruck Fatality Rate Far Exceeds That of Ford Pinto
The Tesla Cybertruck was recalled seven times last year.

National Parks Layoffs Will Cause Communities to Lose Billions
Thousands of essential park workers were laid off this week, just before the busy spring break season.

Retro-silient?: America’s First “Eco-burb,” The Woodlands Turns 50
A master-planned community north of Houston offers lessons on green infrastructure and resilient design, but falls short of its founder’s lofty affordability and walkability goals.

Test News Post 1
This is a summary

Analysis: Cybertruck Fatality Rate Far Exceeds That of Ford Pinto
The Tesla Cybertruck was recalled seven times last year.

Test News Headline 46
Test for the image on the front page.
Urban Design for Planners 1: Software Tools
This six-course series explores essential urban design concepts using open source software and equips planners with the tools they need to participate fully in the urban design process.
Planning for Universal Design
Learn the tools for implementing Universal Design in planning regulations.
EMC Planning Group, Inc.
Planetizen
Planetizen
Mpact (formerly Rail~Volution)
Great Falls Development Authority, Inc.
HUDs Office of Policy Development and Research
NYU Wagner Graduate School of Public Service


