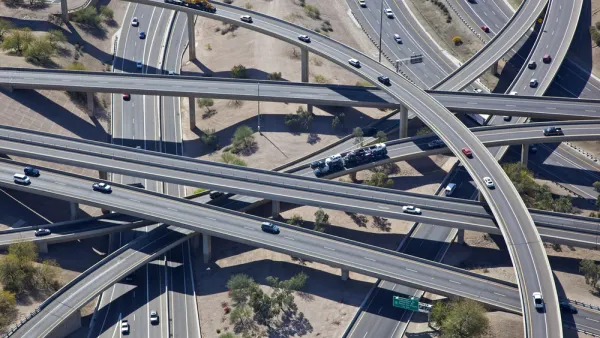
On the cusp of a new infrastructure proposal from the White House, how has federal spending changed over the last 70 years? What will it take to reach historical averages?

Following up on this article published for Infrastructure Week last year, Jeff Davis takes a look at federal infrastructure spending with an eye for what it would take to match historical levels. For the most part, these numbers look at federal grants as a percentage of total U.S. GDP.
Some highlights from the latter half of the 20th century include the 1956 Interstate Highway law, tripling infrastructure grants as a share of GDP, as well as the 1972 Clean Water Act, "which provided an at-the-time staggering amount of $18 billion in general fund contract authority for sewer grants, and the 1970 and 1974 mass transit laws."
Davis notes that the apparent decline in water grants during the 1980s is misleading: "in 1987, the Clean Water Act switched away from making sewer grants to localities and instead started using federal money to endow state revolving funds to make low-interest loans to localities."
Today, Davis concludes, "equivalent total spending to hit the 1957-1986 average would be $92 billion per year, the total spending to maintain the average of the last 30 years (1987-2016) would be $69 billion per year, and the total spending to maintain the average spending level of the last 60 years would be $80.7 billion per year."
FULL STORY: Infrastructure Week Preview – Federal Infrastructure Grants: How to Get Back to “Average?”

Analysis: Cybertruck Fatality Rate Far Exceeds That of Ford Pinto
The Tesla Cybertruck was recalled seven times last year.

National Parks Layoffs Will Cause Communities to Lose Billions
Thousands of essential park workers were laid off this week, just before the busy spring break season.

Retro-silient?: America’s First “Eco-burb,” The Woodlands Turns 50
A master-planned community north of Houston offers lessons on green infrastructure and resilient design, but falls short of its founder’s lofty affordability and walkability goals.

Test News Post 1
This is a summary

Analysis: Cybertruck Fatality Rate Far Exceeds That of Ford Pinto
The Tesla Cybertruck was recalled seven times last year.

Test News Headline 46
Test for the image on the front page.
Urban Design for Planners 1: Software Tools
This six-course series explores essential urban design concepts using open source software and equips planners with the tools they need to participate fully in the urban design process.
Planning for Universal Design
Learn the tools for implementing Universal Design in planning regulations.
EMC Planning Group, Inc.
Planetizen
Planetizen
Mpact (formerly Rail~Volution)
Great Falls Development Authority, Inc.
HUDs Office of Policy Development and Research
NYU Wagner Graduate School of Public Service


