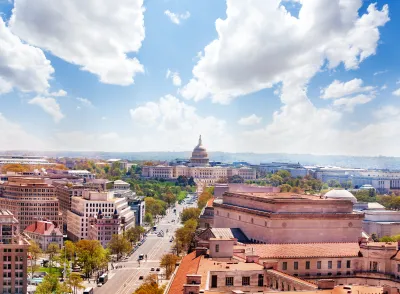
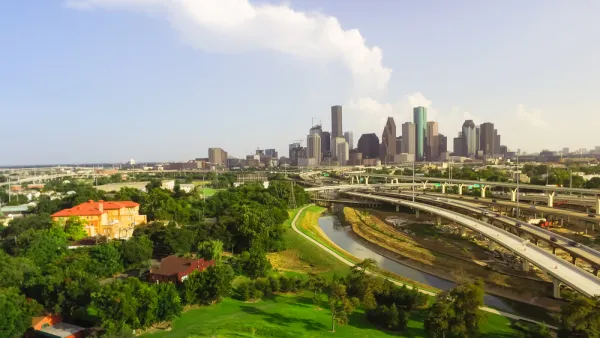
A rising tide doesn't necessarily lift all boats—even in a time of (mostly) decreasing income inequality at the city level.

A recent study from the Brookings Institution examines income inequality at the city and metropolitan area level around the country. The major findings of the study, explained by a post sharing the new study:
- Among big cities, Atlanta and Washington, D.C. exhibited the highest rates of income inequality in 2016.
- Levels of inequality in cities reflect broader income disparities in metropolitan areas.
- More cities experienced declines in income inequality from 2014 to 2016 than saw increases.
- In contrast to the city pattern, increases in metropolitan income inequality outnumbered declines.
- Some cities posted stunning increases in top incomes from 2014 to 2016.
- Income trends at the top of the distribution in cities and metro areas had little relationship to trends at the bottom of the distribution from 2014 to 2016. I
As a follow up to the article presenting the findings of the new report, an article by Axios presents the report's findings in a graphic format. Caitlin Owens writes the post and Chris Canipe creates a helpful pair of infographics to help illustrate the cities with the largest and smallest income gaps.
FULL STORY: City and metropolitan income inequality data reveal ups and downs through 2016

Analysis: Cybertruck Fatality Rate Far Exceeds That of Ford Pinto
The Tesla Cybertruck was recalled seven times last year.

National Parks Layoffs Will Cause Communities to Lose Billions
Thousands of essential park workers were laid off this week, just before the busy spring break season.

Retro-silient?: America’s First “Eco-burb,” The Woodlands Turns 50
A master-planned community north of Houston offers lessons on green infrastructure and resilient design, but falls short of its founder’s lofty affordability and walkability goals.

Test News Post 1
This is a summary

Analysis: Cybertruck Fatality Rate Far Exceeds That of Ford Pinto
The Tesla Cybertruck was recalled seven times last year.

Test News Headline 46
Test for the image on the front page.
Urban Design for Planners 1: Software Tools
This six-course series explores essential urban design concepts using open source software and equips planners with the tools they need to participate fully in the urban design process.
Planning for Universal Design
Learn the tools for implementing Universal Design in planning regulations.
EMC Planning Group, Inc.
Planetizen
Planetizen
Mpact (formerly Rail~Volution)
Great Falls Development Authority, Inc.
HUDs Office of Policy Development and Research
NYU Wagner Graduate School of Public Service


