


Recent earthquake response efforts in Haiti showed how comparing satellite imagery could help to identify physical changes in the damaged country and assist rescue workers. That same sort of imagery could play a similar role for urban planners.
January 11: buildings and roads. January 12: rubble.
The massive earthquake that struck the Caribbean nation of Haiti last week toppled buildings and littered the capital city of Port-au-Prince with the crumbled concrete and shattered glass of a broken metropolis. The images beamed across the Internet show the grisly result of the devastating earthquake.
But then, a different kind of image popped up. Google Maps released a series of satellite imagesof different parts of the city, showing in the same scale Haiti's urban landscape shortly before and immediately after the earthquake.
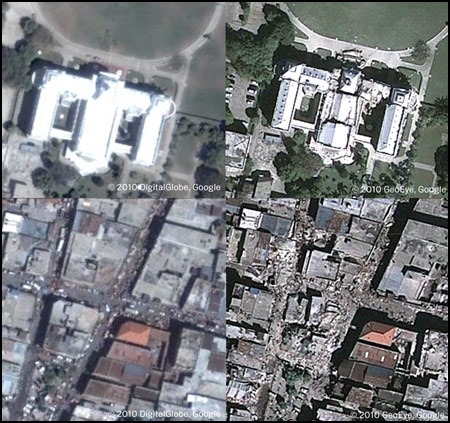
On their own, the images of the earthquake's destruction are astounding. But combined with previous imagery of what those now-crumbled places once looked like, the context amplifies the impact. This use of comparable satellite imagery is an attempt by Google to assist in the recovery effort. The company's Lat Long Blog says it "received numerous requests from relief organizations and our users to share recent satellite imagery of the country."
That imagery, it turns out, can provide much more than context. With suddenly outdated maps showing roadways that are now inaccessible and bridges that are uncrossable, this satellite imagery is actually being used in rescue and recovery efforts. Agreements like the International Charter Space and Major Disasters combine the satellite capacity of many space and meteorological groups around the world to make similar imagery available after such natural disasters.
Using satellite imagery for disaster relief offers what many aid organizations see as a great benefit. But while the disaster relief effort is undoubtedly useful, the vast amount of satellite imagery also represents a huge potential for tracking and understanding urban changes in non-disaster situations.
Satellite imagery is already used for a variety of planning and planning-related tasks, from infrastructure planning to forestry management to climate monitoring. It's been used in many developing countries where reliable mapping is hard to come by.
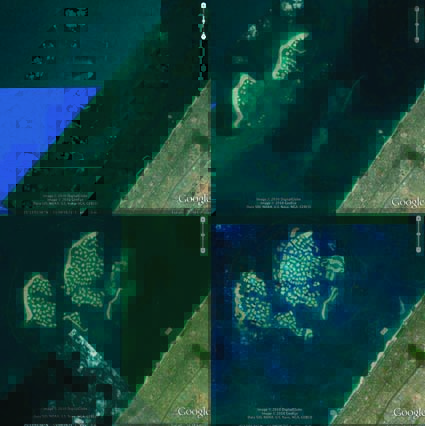
But having a zoomable vantage point a couple hundred miles above the earth can do a lot more than simply replace shoddy information collected on the ground. This bird's eye view can provide a point-in-time look at urban areas that can be compared with the imagery of the past.
An update of the Google Earth application allows users to "go back in time" for much of its imagery, accessing satellite images from different points in time from the same vantage point. It's not a day-by-day photographic memory, but turning it into one is little more than a question of data storage. Most satellites used for geographic imagery like that used in Google Earth circle the globe about once every 90 minutes. In theory, some places could have multiple snapshots taken every day, providing a fairly in-depth profile.
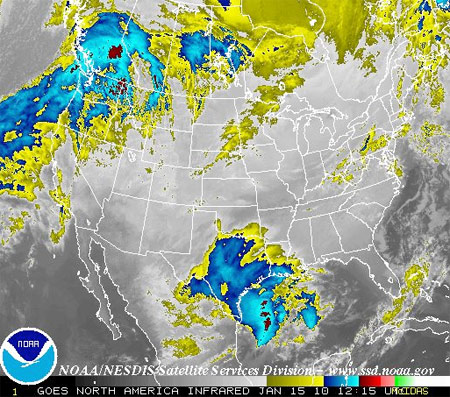
Much in the same way weather satellites take hourly snapshots to track the motionof clouds and weather events, urban-focused satellites could provide a similar stop-motion effect documenting urban growth and change – something not easily visualized.
Images taken over time could show the growing edges of a metropolis. Or help identify perennially park-poor parts of town. Or the spread of nighttime lights into formerly vacant areas over the course of a decade. By monitoring these sorts of time-based changes, planners and policymakers could potentially take on a better understanding of how places change and what patterns might be causing urban problems.
But compiling and managing years worth of satellite imagery is no small task. Awash in a similar amount of visual data, the U.S. military is struggling to organize the hundreds of thousands of hours of video footage captured by drone aircraft in Iraq and Afghanistan. Despite the glut, the military is keeping all that video information so it can monitor patterns and trends on the battlegrounds. And as data storage costs drop and capabilities rise, maintaining such vast collections of visual data will become even more feasible.
This sort of information could play a big role in changing the way people understand cities as evolving places. By being able to literally watch how cities physically change, planners and policymakers can work more proactively to address urban problems and prevent future problems from occurring. Disaster relief may just be the first step.
Nate Berg is assistant editor of Planetizen.

Friday Eye Candy: Full-Color, HD Videos Taken from Space
For the first time, full-color videos of the earth's surface will be made available to the public, with added options for paying customers. The imagery comes from two cameras on the International Space Station.
Worst-Case Tsunami Scenario Mapped
The event of a huge earthquake off the Aleutian Islands could send a devastating tsunami towards the West coast of the U.S. Researchers have released maps of what a worst-case scenario might look like for coastal communities.

New Book Shows How Geographic Technology Tackles Global Challenges
In his new book, Jack Dangermond explores the transformative impact of GIS technology in solving global challenges through spatial data, highlighting its widespread application across sectors and its potential to design sustainable futures.

Analysis: Cybertruck Fatality Rate Far Exceeds That of Ford Pinto
The Tesla Cybertruck was recalled seven times last year.

National Parks Layoffs Will Cause Communities to Lose Billions
Thousands of essential park workers were laid off this week, just before the busy spring break season.

Retro-silient?: America’s First “Eco-burb,” The Woodlands Turns 50
A master-planned community north of Houston offers lessons on green infrastructure and resilient design, but falls short of its founder’s lofty affordability and walkability goals.

Test News Post 1
This is a summary

Analysis: Cybertruck Fatality Rate Far Exceeds That of Ford Pinto
The Tesla Cybertruck was recalled seven times last year.

Test News Headline 46
Test for the image on the front page.
Urban Design for Planners 1: Software Tools
This six-course series explores essential urban design concepts using open source software and equips planners with the tools they need to participate fully in the urban design process.
Planning for Universal Design
Learn the tools for implementing Universal Design in planning regulations.
EMC Planning Group, Inc.
Planetizen
Planetizen
Mpact (formerly Rail~Volution)
Great Falls Development Authority, Inc.
HUDs Office of Policy Development and Research
NYU Wagner Graduate School of Public Service