


A new animated map presents the reported cases of potholes in Chicago since November—the maps colorful and provides insights into how the city, and our relationship to it, can change with time.
Vikki Ortiz Healy reports for the Chicago Tribune about a new animated map of pothole reports from November to this week in the city of Chicago. To create the map, Elliott Ramos downloaded data from the city of Chicago’s website, “which meticulously documents all pothole reports.”
The map blinks like a Christmas tree as the number and density of reported potholes expands and contracts with time. January through February, for instance, might require sunglasses for viewing given the density of reported potholes.
According to Healy’s article, Ramos created the visualization to help residents understand the nuances of how data manifests around the city. “At a wide glance, Ramos’ map, which took him less than an hour to create, shows an orange dot for each pothole report. The orange fades to yellow/pink as time elapses. The point, he said, is to demonstrate how the number of pothole reports changes over time, and that there can be days with a surge of reportings — such as just after Jan. 1 or at Jan. 15 — perhaps when more people are home to notice or are inspired by media reports,” writes Healy.
FULL STORY: Where are the most pot holes in the city? There's an app for that.

A Central Hub for Open Data
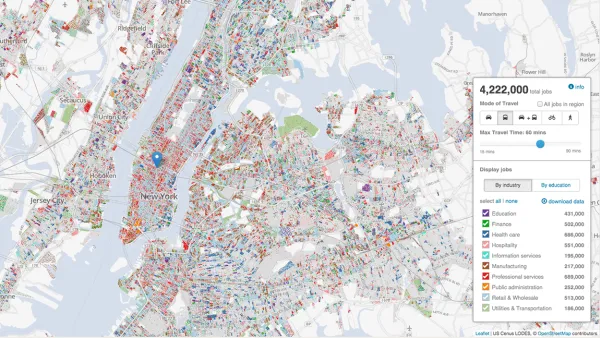
Designed by researchers at the University of Chicago, the Plenario platform gathers all available open data for a specific area. Then it presents the data in an easy-to-use format.
The Growing Importance of Location Intelligence
Location intelligence is transforming decision-making, with an increasing number and type of organizations modernizing operations with a geographic approach to problem-solving, planning, and prediction.
Real-Time Art Installation Reveals the Many Dimensions of Data
Using a wagon filled with phones, an artist in Berlin demonstrated the disconnect between data and the real world.

National Parks Layoffs Will Cause Communities to Lose Billions
Thousands of essential park workers were laid off this week, just before the busy spring break season.

Retro-silient?: America’s First “Eco-burb,” The Woodlands Turns 50
A master-planned community north of Houston offers lessons on green infrastructure and resilient design, but falls short of its founder’s lofty affordability and walkability goals.

Delivering for America Plan Will Downgrade Mail Service in at Least 49.5 Percent of Zip Codes
Republican and Democrat lawmakers criticize the plan for its disproportionate negative impact on rural communities.

Test News Post 1
This is a summary

Test News Headline 46
Test for the image on the front page.

Balancing Bombs and Butterflies: How the National Guard Protects a Rare Species
The National Guard at Fort Indiantown Gap uses GIS technology and land management strategies to balance military training with conservation efforts, ensuring the survival of the rare eastern regal fritillary butterfly.
Urban Design for Planners 1: Software Tools
This six-course series explores essential urban design concepts using open source software and equips planners with the tools they need to participate fully in the urban design process.
Planning for Universal Design
Learn the tools for implementing Universal Design in planning regulations.
EMC Planning Group, Inc.
Planetizen
Planetizen
Mpact (formerly Rail~Volution)
Great Falls Development Authority, Inc.
HUDs Office of Policy Development and Research
NYU Wagner Graduate School of Public Service