


Transit-oriented cities are safer than car-dependent cities of comparable size, especially if one considers traffic fatalities in car-dependent cities.

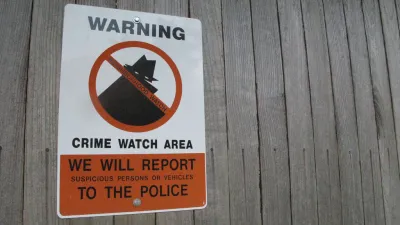
Some months ago, a blog post by Todd Litman pointed out that transit-oriented cities tend to have less overall crime. This post inspired me to address the relationship between big-city violence and big-city sprawl, but in a slightly different way.
First, I decided to focus on the crime most likely to be actually reported to police (that is, homicide), as opposed to lesser crimes which might inspire less police interest. Among the 30 largest U.S. cities, there are only six where public transit ridership is truly substantial (over 20 percent of commuters): New York, Philadelphia, Boston, Washington, Chicago, and San Francisco. In 20 cities, fewer than 10 percent of commuters used transit. In an "in-between" group of four cities (Baltimore, Portland, Seattle, Los Angeles) between 10 and 20 percent of commuters used transit.
The high-transit group's murder rates ranged between 5.1 per 100,000 residents (New York) and 21.5 per 100,000 (Philadelphia), with a median of 11.4.(1)
The medium-transit group's murder rates varied more widely, mainly because of the presence of Baltimore (34.9 murders per 100,000) in this group. Although this outlier inflates the group's mean homicide rate, its median homicide rate was only 5.7, lower than the high-transit cities.(2) Or to describe the situation another way, if we group the ten cities with transit modal shares over 10 percent, their collective median is 8.7 homicides per 100,000.
What about the low-transit group? The median homicide rate for the low-transit cities was 8.7(3)—exactly the same as the median for the cities with transit mode shares over 10 percent, though slightly lower than the median for the six most transit-oriented cities. Thus, it appears that there is not a significant difference in violent crime between the most car-dominated cities and more transit-oriented cities (especially since many of the "car cities," such as Houston, have annexed hundreds of square miles of suburban territory). Given the wide range of factors affecting crime rates, this lack of difference certainly accords with my common sense.
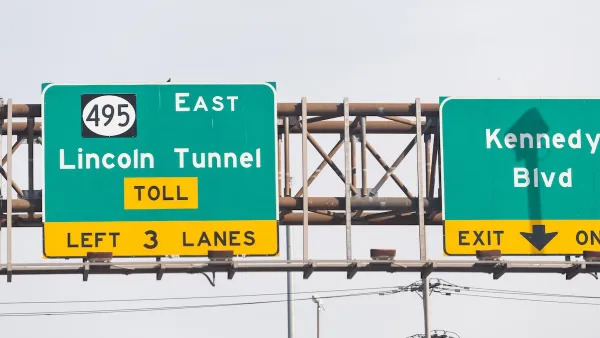
Second, I decided to focus on danger from cars as well as on danger from crime. In many cities, a stranger with a car creates far more risk than a stranger (or even a non-stranger) with a gun. For example, Austin's auto-crash fatality rate (6.4 per 100,000) is more than 60 percent higher than its murder rate (3.7).
Residents of more transit-oriented cities, by contrast, are at less risk from speeding cars. In particular, the nine most transit-oriented cities have a mean crash-fatality rate of 4.1 per 100,000, and a median crash-fatality rate of 4.0 (including both pedestrian and driver deaths).
How do the low-transit cities compare? Their mean fatality rate is 7.2 per 100,000 residents—about 75 percent higher than that of the more transit-oriented cities. (4) Similarly, their median fatality rate is 8.3—more than twice that of the more transit-oriented cities. To put the matter another way: only one of the "low transit" cities, San Jose, had a car death rate as low as the median for the more transit-oriented cities. Since cities built around the automobile tend to have lots of high-speed arterials (thus making accidents more likely to be fatal), this result too accords with common sense.
If one aggregates the homicide rate and the car-crash rate, we find that the cities with transit mode shares over 10 percent have a median "violent death" rate of 12.7 per 100,000, while the cities with lower transit mode shares have a median "violent death" rate of 17 per 100,000. So on balance, it does seem that the risk of violent death in car-oriented cities is higher than in transit-oriented cities.(5)
(1) homicide rates for other cities: Chicago 18.5, Washington 13.9, Boston 9, San Francisco 8.4. In this even-numbered group, I calculated the median by averaging the third most dangerous city (Washington) and the fourth most dangerous (Boston).
(2) homicide rates for other cities: Portland 3.3, Seattle 3.7, Los Angeles 7.8.
(3) homicide rates by city: Austin 3.7, Charlotte 6.4, Columbus 11, Dallas 12.4, Denver 6.2, Detroit 54.6, El Paso 3.4, Fort Worth 5.7, Houston 10, Indianapolis 11.6, Jacksonville 11.1, Las Vegas 5.1, Louisville 9.1, Memphis 20.2, Milwaukee 15.2, Nashville 10, Phoenix 8.3, San Antonio 6.4, San Diego 3.5, San Jose 4.6.
(4) City-by-city traffic death rates, as of 2011, are as follows: New York 2.8, Philadelphia 5.6, Boston 2.0, Washington 5.3, Chicago 4.3, San Francisco 3.6, Baltimore 4.0, Seattle 3.1, Portland 5.6, Austin 6.4, Charlotte 7.6, Columbus 7.0, Denver 5.2, Detroit 11.1, El Paso 10.5, Fort Worth 8.3, Houston 9.1, Jacksonville 9.6, Las Vegas 4.2, Memphis 11.3, Milwaukee 6.1, Phoenix 8.3, San Antonio 8.7, San Jose 3.6, Dallas 8.6. My primary source, City Data, did not have fatality rates for Los Angeles, as well as for three more car-oriented cities (Nashville, Louisville and Indianapolis).
(5) In addition, many homicides involve disputes between acquaintances, and thus involve little risk to the general public. If one assumes that half of homicides fall into this category, then the gap between the "high/medium transit" and "low transit" cities widens. But city-by-city data on the circumstances of homicides are pretty sparse, so I am not sure whether the data can support such assumptions.


Study: Warm Weather Is a Factor in Increased Road Deaths
A downward trend in deaths from car crashes reversed sharply in 2015. Many blamed cell phones and the distractions they can cause, but a recent study complicates that hypothesis.
The Spectre of Death and Speeding
New speed limit signs will alert drivers that they are going to fast by showing them an image of a skeleton -- an image intended to warn drivers that their speeding could kill.
Is Trump’s Reversal of Congestion Pricing Legal?
Gov. Hochul says New York City will “keep its cameras on.” Can the administration legally end the nation's first cordon pricing program?

Analysis: Cybertruck Fatality Rate Far Exceeds That of Ford Pinto
The Tesla Cybertruck was recalled seven times last year.

National Parks Layoffs Will Cause Communities to Lose Billions
Thousands of essential park workers were laid off this week, just before the busy spring break season.

Retro-silient?: America’s First “Eco-burb,” The Woodlands Turns 50
A master-planned community north of Houston offers lessons on green infrastructure and resilient design, but falls short of its founder’s lofty affordability and walkability goals.

Test News Post 1
This is a summary

Analysis: Cybertruck Fatality Rate Far Exceeds That of Ford Pinto
The Tesla Cybertruck was recalled seven times last year.

Test News Headline 46
Test for the image on the front page.
Urban Design for Planners 1: Software Tools
This six-course series explores essential urban design concepts using open source software and equips planners with the tools they need to participate fully in the urban design process.
Planning for Universal Design
Learn the tools for implementing Universal Design in planning regulations.
EMC Planning Group, Inc.
Planetizen
Planetizen
Mpact (formerly Rail~Volution)
Great Falls Development Authority, Inc.
HUDs Office of Policy Development and Research
NYU Wagner Graduate School of Public Service